Lessons Learned from Solarize Campaigns in Connecticut

Introduction of Solarize and SEEDS II
Solarize is a unique community-based program that leverages peers and social networks to encourage residential solar adoption through a group pricing strategy. Solarize campaigns spread the knowledge of solar benefits through social networks and engage strong volunteer leadership (“solar ambassadors”) who are passionate about solar energy.
The Yale Solar Energy Evolution and Diffusion Studies (SEEDS) II team has designed, implemented and studied Solarize campaigns as a series of randomized field trials. The SEEDS II team wants to understand two effects: the rates at which households of various income levels adopt solar, and how different types of messaging interact with adoption among these groups.
In addition to Yale School of Forestry and Environmental Studies and the Yale Center for Business and the Environment, the SEEDS II team consists of the nationally recognized non-profit SmartPower, Duke University, Tel Aviv University, Connecticut Green Bank, New York State Energy Research and Development Authority, and MySunBuddy.
The following summary of SEEDS II results is based on Rounds 8 to 10 of Solarize campaigns conducted across Connecticut by the non-profit SmartPower. Round 8 began in April 2017, and Round 10 concluded in September 2018. The reason why SEEDS II starts at Round 8 is that there have been seven other Solarize campaigns prior to SEEDS II. Most of these campaigns were studied in the first Yale SEEDS project, and a prior analysis of Solarize campaigns focusing on Round 8 is published in May 2018.
The basic findings are clear: targeted messaging matters. People are more responsive to messages that focus on individual benefits like energy cost savings than messages that focus on community benefits and social norms. In Solarize Round 8, for instance, towns promoting individual messaging exhibited nearly 50 percent more total installations than towns with community-based messaging.
Results from Rounds Nine and Ten
Seven towns participated in Round 9: Bethel, Canton, Fairfield, Hamden, New Haven, North Haven, and Windham. A total of 137 contracts, out of 766 leads, were signed through the town-chosen installer. This constitutes 1,188 kW of total installed capacity. If we include other installers, the number of contracts signed roughly doubles.
Round 10 of Solarize took place in five towns, including Brookfield, Cheshire, Middlefield, Pomfret, and Vernon. By the end of Round 10, a total of 77 contracts, out of 559 leads, were signed through the town-chosen solar installer. This resulted in a total capacity of 777 kW.
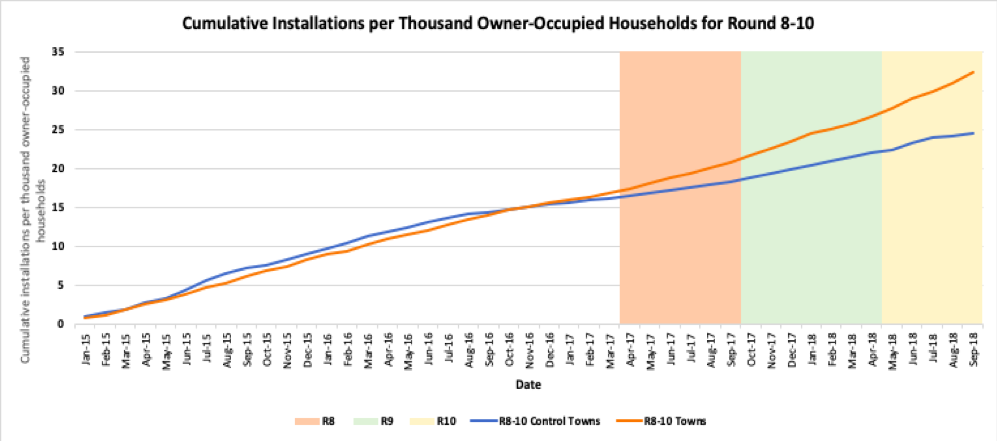
Figure 1 shows cumulative installations per thousand owner-occupied households for all Round 8-10 towns (combined) compared to control towns (combined). Before the campaigns began, in April 2017, Solarize towns and control towns exhibited a similar trend in solar growth: Solarize towns had cumulative installations of 17.41 per thousand households and control towns had cumulative installations of 16.51 per thousand households.
After Round 10 ended, in September 2018, Solarize Round 8-10 towns had cumulative installations of 32.29 per thousand households; this is an 85 percent increase over the campaign period. Control towns had cumulative installations of 24.59 per thousand households; this is 49 percent increase.
Comparing Community- and Individual-oriented Messaging
SEEDS II analyzes two different types of messaging: community-oriented and individual-oriented. Community messaging highlights solar installation as a community activity. It can create a positive norm around solar energy and accelerates solar adoption in the town. Individual-oriented messaging focuses on how solar adoption can save money and stabilize electricity bills.
The table below provides a summary of towns that received individual- and community-oriented messages during Rounds 8, 9, and 10. It is important to note that towns like Canton, Fairfield, and Hamden had taken part in prior Solarize campaigns. This means that they were already aware of solar benefits.
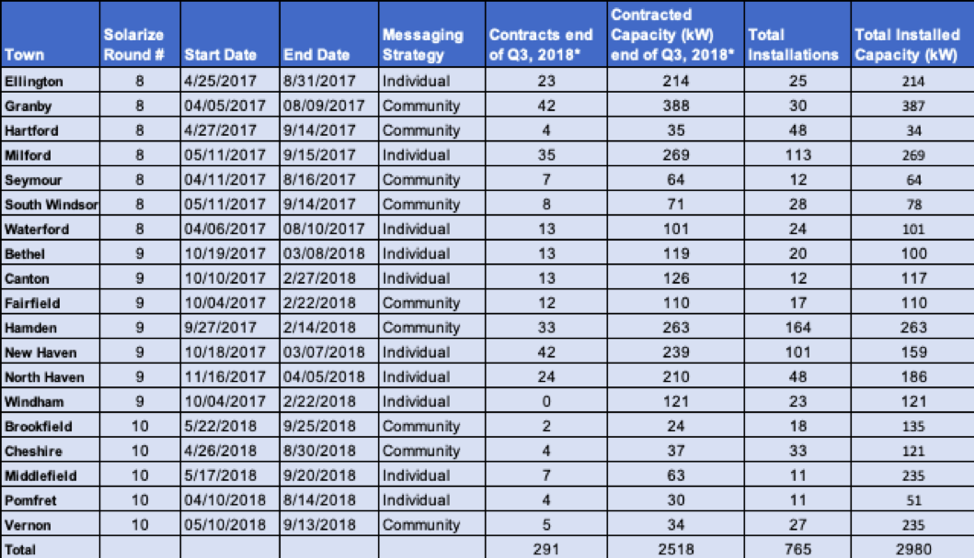
Table 1: Summary of Solarize CT Round 8, 9, and 10 towns
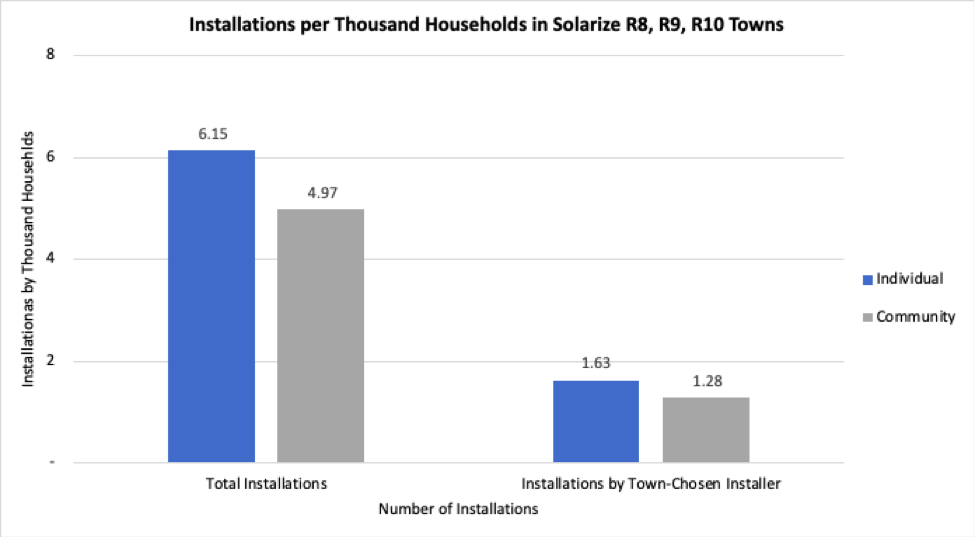
Figure 2 shows the number of installations per thousand households by messaging type for Rounds 8, 9, and 10 (combined). Towns that received messages at the individual level exhibit a much higher number of installations compared to towns that had community-focused messaging. In addition, Solarize campaigns seem to increase overall interest in solar for both the town-chosen installer and other installers.
Differences across Income Groups
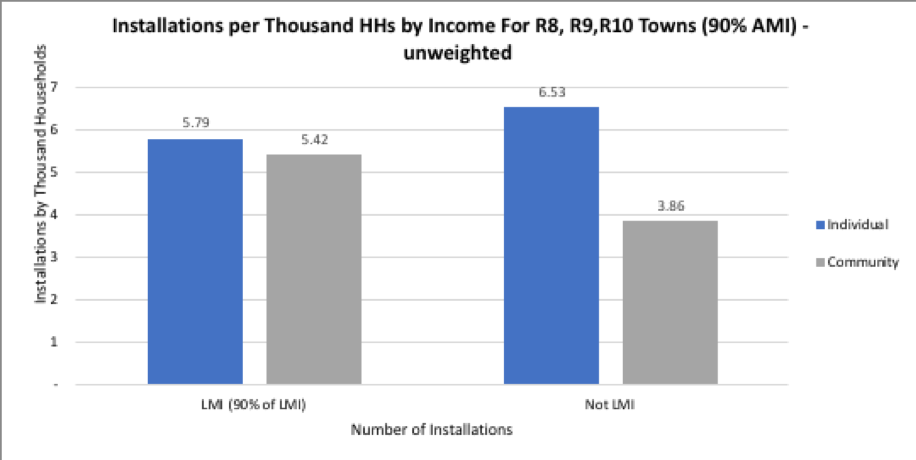
Another key piece of SEEDS II is to examine community solar adoption rates across income groups. Figure 3 shows the result of total solar installation by income group for Rounds 8, 9, and 10. In this study, low- and middle-income (LMI) is defined as households below 90 percent of the area median income (AMI), according to data from Connecticut Department of Housing.
Our analysis shows that individual messaging is more effective than community-focused messaging for both LMI and non-LMI communities. However, this difference is much more pronounced for non-LMI communities.
With individual messaging, LMI groups’ average installation rate is 5.79 per thousand owner-occupied households; this is only 6.4 percent higher than community messaging. Through individual-based messaging, non-LMI groups experience around 70 percent more installations compared to community messaging. This result may change depending on the definition of LMI.
Accelerating Solar Adoption in LMI Households
Three recent rounds of Solarize campaigns in Connecticut reveal that residents are more responsive to messages that focus on individual benefits than those that focus on community benefits. This is consistent with previous analyses.
Overall, from all three Solarize rounds investigated, towns that received individual-targeted messaging witnessed about 24 percent more total installations per thousand households than towns that had community-targeted messaging. There are 968 installations in total from the program after all three rounds of campaigns.
The SEEDS II project also looked into how LMI households react to different messaging types. Similar to the findings above, individual-based messaging better accelerates residential solar installations in LMI communities. These straightforward findings can be incorporated into future Solarize campaigns to improve their effectiveness in spurring solar adoption.
To comment on this article, please post in our LinkedIn group, contact us on Twitter, or use our contact form.